I had an interesting dillema pop up while working on some Photoshop comps that were going to be delivered as PDF files. The PDF exports contained bar charts which were easiest to create using vector paths due to their design style; and while Illustrator may have been easier to handle such content, the project required Photoshop to be used.
The Problem
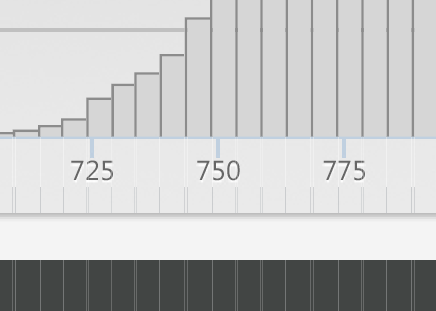
The bar charts were made using vector paths that were staggered vertically and then masked at a specific point. Upon output to PDF, I found that the bar charts not properly concealed by the mask on the Layer Group. You can see the border of the charts extending outside of their Layer Group in this image:

An additional, undesired complication was that each individual bar in the graph was being rendered, well, individually! You can imagine this really slowed down opening the PDF.
This would have been super simply to fix in Illustrator, but since Photoshop still can’t align points of paths (this project was built using CC), I couldn’t simply move all of the bottom points up so that they wouldn’t render below. Doing each one individually was unacceptable, and I was at this point past the deadline on this project.
The Solution
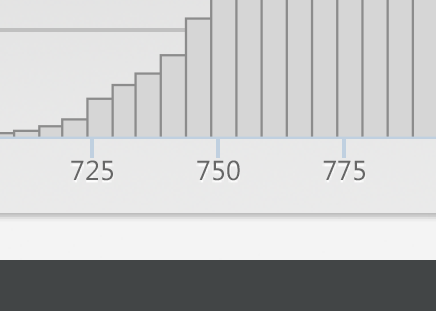
Simple enough: Convert the Layer Group into a Smart Object. Save as PDF, works great, renders faster. Amazing.
